2019-11-06 12:29:00 Wed ET
stock market technology facebook apple microsoft google amazon data platform network scale lean startup artificial intelligence antitrust alpha patent model tech titan unicorn tesla global macro outlook advertisement
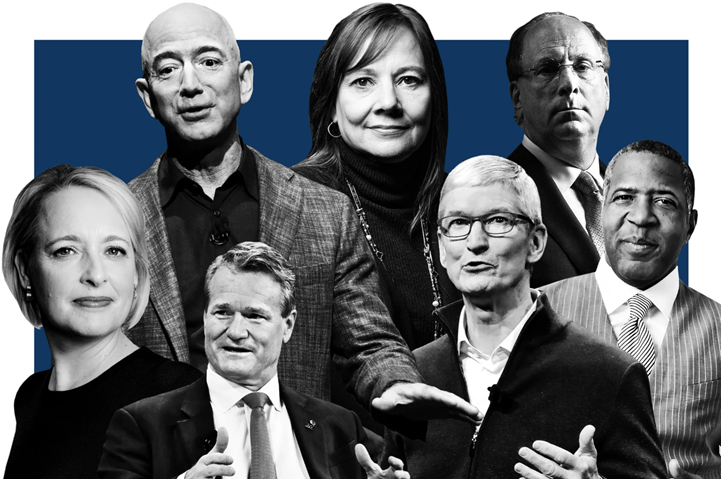
Our fintech finbuzz analytic report shines fresh light on the fundamental prospects of U.S. tech titans Facebook, Apple, Microsoft, Google, and Amazon (F.A.M.G.A.). As of Fall-Winter 2019, this analytic report focuses on the competitive advantages, opportunities, and threats for F.A.M.G.A. in the modern age of digital tech diffusion. Key opportunities arise in the broad context of social media, consumer technology, software, Internet search, e-commerce, and cloud service provision etc. In contrast, the primary threat is closer antitrust scrutiny on the sheer size, power, and product market dominance of F.A.M.G.A. as many U.S. institutions mistrust tech titans in American history. Our fundamental analysis focuses on the key actionable insights and metrics for the corporate performance and stock valuation of each tech titan. Our quantitative analysis accords with the standard approach to discounting-cash-flows (DCF) corporation valuation.
We provide a soft PDF version of this analytic report in the cloud: http://bit.ly/2MCf9WM
This analytic report cannot constitute any form of financial advice, analyst opinion, recommendation, or endorsement. We refrain from engaging in financial advisory services, and we seek to offer our analytic insights into the latest economic trends, stock market topics, investment memes, and other financial issues. Our proprietary alpha investment algorithmic system helps enrich our AYA fintech network platform as a new social community for stock market investors: https://ayafintech.network.
From time to time, top tech titans from Apple and Amazon to Facebook and Google set the industry standards with the first-mover competitive advantage (e.g. Apple and the iPhones, iPads, iPods, and iTunes; Amazon and the e-commerce platform; Google and the Internet search engine algorithm; Facebook and the social media ecosystem; Microsoft and the Windows operating system and Office 365 software suite). These tech titans tend to operate as open platforms with a relentless focus on user acquisition, retention, and monetization. Open platforms often benefit from positive network effects, scale economies, and key information cascades. Positive network effects arise from the fact that each additional user expands exponentially the value of the current open platform. Scale economies emerge when the average cost of production declines with a significant increase in the number of active users worldwide. Information cascades pertain to the fact that a small number of Internet influencers serve as the major touchpoints for transmitting information from small niche segments to the global general public. These positive network effects, scale economies, and information cascades often manifest in the form of higher average profits per user (APPU) over time.
In terms of APPU and several other relevant metrics, Facebook, Apple, Microsoft, Google, and Amazon (F.A.M.G.A.) rank top in comparison to most other traditional corporations. These top tech titans often set the industry standards with substantial competitive moats. Further, these top tech titans operate as effective and profitable platform enterprises. These core platform enterprises monetize on active user data, online advertisement, and software usage worldwide.
Our proprietary alpha stock signals empower investors to better balance their stock portfolios. This delicate balance helps gauge each dynamic conditional alpha, or the supernormal excess stock return to the standard smart beta stock investment strategy. The unique exclusive investment strategy minimizes smart beta exposure to size, value, momentum, asset growth, profitability, and the market risk premium. Our algorithmic system for dynamic asset return prediction relies upon U.S. patent and trademark protection, enforcement, and accreditation. The regular up-to-date disclosure of our proprietary dynamic conditional alphas for F.A.M.G.A. accords with our freemium online search tool available on our AYA fintech network platform: https://ayafintech.network.
We often need to undertake the first key step to ask the right questions. These vital questions illuminate the competitive advantages, opportunities, and threats for the top tech titans F.A.M.G.A. in the current modern age of digital technology diffusion. Our fundamental analysis focuses on the American stock market trends with some supplemental U.S. and non-U.S. public policy implications (especially in terms of antitrust investigations and anti-competitive business practices).
Can Facebook and Google maintain their duopoly over online advertisement?
Can Amazon, Apple, and Microsoft beat their longer-term growth expectations in the competitive landscape of online advertisement?
Does the Internet start to approach a key programmatic inflection point with greater video connectivity?
Do Facebook and Google have the fair chance to tap into e-commerce as Amazon keeps its eyes on online advertisement?
In the grand scheme of mobile system competition between Apple iOS and Google Android, are the 30% app tolls sustainable in the long run?
How can the unique monetization strategies of Apple and Google affect their long-term systemic survival and profitability across the different platform ecosystems?
Does the tripartite regulatory scrutiny pose an antitrust threat to the top tech titans F.A.M.G.A. in the next few years?
Online advertisement has gone through more than a decade of secular growth. An incremental inflection arises around 2013-2014 as mobile video monetization has driven product market share away from offline media and legacy advertisers. In recent years from 2018 to 2019, Internet advertisement starts to show some initial signs of moderate deceleration. However, key stock market analysts and economic media commentators indicate that this deceleration remains transitory. When the core market players such as Facebook, Google, and Amazon etc pivot their smart business operations to monetize from user data and artificial intelligence, Internet ad growth can pick up again.
The unique smart duopoly of Facebook and Google has effectively dominated the recent Internet ad growth for the period from 2014 to 2019. Facebook and Google alone represent more than 80% of Internet advertisement monetization in the U.S. domestic market (and almost 75% of international Internet ad traffic). Several stock market analysts expect Amazon to increase its Internet advertisement across its e-commerce platform ecosystem with 13%-15% market share. However, this third player still remains a minor competitive threat to the current duopoly.
In recent times, Snap and Twitter show indicative Internet ad growth. This positive acceleration further shows some resilience in the recent increase in the number of daily active users for each popular social media platform. These alternative social media outlets continue to be the favorites among many millennials and the younger generations in lieu of Facebook. However, the main corporate performance metrics for Snap and Twitter etc such as R&D innovation and operational profitability have been a bit inconsistent over the last few quarters. Despite their strong year-to-date corporate performance, it is still unclear and controversial to stock market investors whether Snap and Twitter can continue their recent momentum.
Programmatic online advertisement now reaches an inflection point. Beyond this inflection point, the winners garner greater market share gains with better Internet video connectivity. Real-time bids (RTB) continue to grow more than 20% per year from 2018-2019 to 2022-2023. Many fresh digital advertisers start to allocate more than half of their online video expenditures to programmatic RTBs and satellite TV distributions. Amazon and some other smaller online advertisers such as LinkedIn, Pinterest, Snap, Twitter, and Trading Desk etc continue to operate their novel and durable SaaS business models with hefty net profit margins slightly above 30%. In effect, these SaaS business models offer high software margins for these smaller online advertisers to survive in some niche segments. With these deep competitive moats, Amazon and these other smaller players not only continue to sustain their Internet ad operations, but these ex-duo online advertisers are also likely to enjoy high profit margins and high growth rates in the next few years. It is not simple and intuitive to deduce whether Amazon and the smaller online advertisers can rise up to challenge the current duopoly of Facebook and Google. The current market for online ads continues to be a swift moving target as consumer tastes, beliefs, and preferences vary over time.
In the form of antitrust lawsuits and investigations, regulatory headwinds are likely to worsen not only for Facebook and Google but also for the other tech titans such as Apple and Amazon. The core political rhetoric may become more intense as we approach the next American presidential election in mid-to-late-2020. Presidential candidates such as Donald Trump, Joe Biden, and Elizabeth Warren etc can target the tech titans with greater antitrust scrutiny to help assuage ubiquitous consumer concerns over product market power and dominance, user privacy protection, data manipulation, user consent and authentication, and copyright infringement etc.
The primary antitrust regulatory agencies include the Justice Department, Federal Trade Commission, and Senate and House Judiciary Committees in America. In Europe, the European Commission may impose hefty punitive fines and penalties to restrict the sheer size and saturation of Amazon, Facebook, and Google. In fact, this inter-continental antitrust sentiment extends well beyond social media, Internet search, and online advertisement. Moreover, this antitrust sentiment further casts dark clouds on unfair and anti-competitive business practices in e-commerce and cloud software service provision. When push comes to shove, the general law of inadvertent consequences counsels caution.
Given their dominant position in online advertisement with strong secular tailwinds, Facebook and Google have generally beaten Wall Street revenue expectations in recent years. This duopoly represents more than 80% of online ad capital flows in America and about 73%-75% of global online ad sales. However, Facebook has already suffered disruptive forces from the Cambridge Analytica data debacle to Russian interference in U.S. elections since early-2018. As a result, Facebook now experiences a drastic decline in net profits from 43% to about 30% for the fiscal period from 2017Q3 to 2019Q3. Also, Google experiences a similar decline in net profits from well above 30% to about 15%-20% for the fiscal period from 2017Q3 to 2019Q3. This bottomline deceleration rings the alarm bell for both companies that rely heavily on online ad monetization.
Product market dominance empowers Facebook and Google to move fast to break the conventional wisdom with new disruptive innovation. This dominance adds to consistent and impressive topline revenue growth for the current online ad duopoly. Nevertheless, a fairly constant total addressable market sets limits on attainable sales and net profits as mobile usage now serves as a close substitute for desktop usage. Facebook and Google can attempt to compress this monetization gap by better targeting specific demographic audiences. At any rate, most stock market investors should receive hefty rewards for placing equity bets on Facebook and Google in the recent decade. It is less clear whether the duopoly can maintain their product market dominance with consistent revenue and net profit outperformance in the current competitive environment from 2020 to 2025.
As of mid-2019, U.S. consumers spend almost 50% of leisure time on the Internet, and more than half of this Internet usage involves the use of mobile devices. Also, U.S. consumers spend another 35% of online time on mobile video. In light of these secular trends, Facebook and Google strategically pivot to target the vast majority of active mobile video users in America. This main pivot can allow both tech titans to secure their domestic competitive moats. In practice, these competitive moats further empower Facebook and Google to leverage their current strengths in social media and Internet search outside the home jurisdiction. As the current U.S. focus extends to the global general public, stock market analysts can expect Facebook and Google to increase their current mobile video absorption worldwide.
In the longer run, the major law of large numbers may catch up. Amazon, LinkedIn, Pinterest, Snap, Twitter, and Trading Desk etc can tap into the uncharted territories of U.S. and international mobile video ads. To the extent that the other key platform enterprises rise up to challenge the current duopoly, Facebook and Google need to sharpen the saw to more specifically target the younger mobile video users with artificial intelligence and smart data analysis. In this neutral light, key stock market investors and analysts should continue to monitor the latest economic trends of mobile video advertisement relative to more traditional desktop audio and text in the next few years from 2020 to 2025.
In the meantime, Amazon specializes in e-commerce and cloud service provision; Apple focuses on multi-media services (such as Siri, Apple Music, and Apple TV) and smart mobile devices (such as iPhones, iPads, iPods, iTunes, and HomePods); and Microsoft continues to leverage its Office niche software suite and Windows operating system. In contrast to the smaller social media players, Amazon, Apple, and Microsoft can increase Internet ad endeavors across their prevalent platform ecosystems. For instance, Apple can introduce both static and dynamic online ads when iPhone users watch the latest episode of soap opera on Apple TV; Amazon can insert ad images and video clips in addition to customer reviews on the current e-commerce platform; and Microsoft can start to embed Internet advertisement in the Windows operating system, Edge web browser, and Office software suite etc. Apple and Microsoft can further incorporate online ads into the respective iOS and Windows apps.
At this stage, online advertisement represents about 15%-20% of total revenue for each of the top 3 tech titans Amazon, Apple, and Microsoft. Internet advertisement may have been a secondary focus for the trio, but these tech titans still have a lot of room for future growth. Regardless of intense competition with Facebook and Google, it is hard to imagine why Amazon, Apple, and Microsoft would voluntarily choose not to jump on the bandwagon of online advertisement.
However, the ambivalent inclusion of Internet ads trades off user experience with Internet traffic and key ad revenue. On balance, Amazon, Apple, and Microsoft can better balance active user experience and ad revenue generation to garner greater product market support within the extant platform ecosystems. In stark contrast to LinkedIn, Pinterest, Snap, Twitter, and Trading Desk, the tech trio Amazon, Apple, and Microsoft may have a fair chance to disrupt the default duopoly in the broader competitive landscape of online advertisement.
The recent April 2019 eMarketer survey indicates that the Internet now approaches a programmatic inflection point with greater video connectivity. For the period from 2016 to 2021, stock market analysts expect U.S. programmatic digital display ad expenditures to increase from $25 billion to more than $80 billion per year. At the same time, this salient annual growth decelerates from 35% to 15% over the same time frame. As of 2019Q3, numerous stock market investors and economic media commentators expect to see more video content curation or at least 65%-70% of total online advertisement. This core thesis accords with the prior emphasis on the programmatic tilt toward mobile video ads.
Meanwhile, we can observe another well-known trend in the U.S. market for video connectivity. There is now fierce competition among many media service and video content providers Amazon, Apple, and Disney, HBO, NBC, Netflix, WarnerMedia, and YouTube etc. In recent times, several media service providers start to acquire exclusive licenses for specific TV shows, films, movies, and so forth. For instance, WarnerMedia expects to confirm an exclusive license for HBO to stream one of the most popular TV shows, Friends, in addition to Pretty Little Liars and The Fresh Prince of Bel Air. Also, NBC attempts to secure the exclusive license for streaming all 9 seasons of The Office. Moreover, Apple TV enters into multi-year partnerships with Oprah Winfrey Network as well as Jennifer Aniston and Reese Witherspoon. Although it can be easy for these video service providers to insert programmatic online ads into some episodes of TV shows, films, and movies etc, the U.S. market for video connectivity eventually may mature to the inflection point of saturation.
In this light, intense competition breeds efficiency as these media service providers cater relevant online ads and video clips to behavioral target audiences across U.S. states. American viewers may end up with having to stick with some specific video service providers to watch favorite shows and movies. In a similar vein, video clips, online ads, and other information cascades decompose into fractal niche segments. In the broader context, the next economic downturn can serve as the moment of truth for this unique video service industry. When push comes to shove, economic considerations may finally force difficult decisions.
Amazon, Alibaba Taobao, and eBay represent the core lion share of e-commerce revenue in the unique total addressable market. Under the current business model, third-party sellers and other retailers have to pay for appearing more frequently in onsite search results and contextual placements. These e-commerce platforms keep the transactions on-site so that everyone is a winner. Specifically, the buyer gets better bargains on the e-commerce platform (in contrast to brick-and-mortar alternatives); the seller focuses on closing more deals via online ads, contextual placements, and relevant customer reviews and testimonies; and the e-commerce platform orchestrator earns transaction fees as return spreads between the buyer and the seller.
Facebook demonstrates a clear intention to enter e-commerce by introducing the unique exclusive Marketplace for online transactions. In recent times, Facebook experiments with new shopping-cart integration across the social media platform ecosystem of Facebook, Messenger, Instagram, and WhatsApp. On the one hand, Facebook continues to operate as the most popular social media outlet with more than 2 billion active users worldwide. On the other hand, Facebook now seeks to develop a new e-commerce marketplace within the prevalent platform ecosystem. In the near-term, however, it may be difficult for Facebook to reach a critical mass for positive scale economies and network effects.
Moreover, Google tests several new e-commerce ad initiatives. Google facilitates online transactions in close proximity to online ad images. Google further seeks to integrate e-commerce functions more closely with YouTube. However, it remains debatable whether buyer intentions are the same across Amazon, Facebook, and Google. Most stock market investors and analysts would remain more circumspect in the sense that Facebook and Google may or may not attract prospective buyers from Amazon, Alibaba Taobao, and eBay. In other words, U.S. prospective buyers may still prefer to shop on Amazon and eBay, and Asian prospective buyers may still prefer to shop on Alibaba Taobao; whereas, both Facebook and Google cannot readily reposition themselves as e-commerce platforms. Each of the 2 tech titans already represents a new force of disruptive innovation in social media or Internet search. It is difficult for Facebook and Google to institute the dual transformation into e-commerce due to high barriers to entry.
As of 2019Q3, both Apple App Store and Google Play charge 30% app tolls. The conventional wisdom suggests that active users have to pay for key online services. Large video game makers such as Zynga, Electronic Arts, King, Activision Blizzard, Funplus, and so on as well as Internet dating websites such as Bumble, eHarmony, and Match (Match.com, Tinder, OkCupid, and PlentyOfFish etc) can afford to pay the 30% iOS and Android app tolls. However, the status quo is negative and even anti-competitive for fresh startups. To the extent that the 2 tech titans monopolize the respective Apple App Store and Google Play, the antitrust regulatory agencies may challenge the status quo sooner or later. A sniff test of 30% app taxes cannot be favorable.
Back-of-the-envelope calculations show that if Apple and Google reduce their 30% app tolls by half to 15% commissions, this compromise would cause double-digit declines in the bottomline for both app platforms. These 2 tech titans can continue to defend their massive positive scale economies and network effects. Public noise and outrage may ultimately force both platforms to cut substantially their app taxes for the sake of both fair trade and startup innovation. This logic suggests that the current 30% app tolls cannot sustain as competitive moats in the longer run. Apple and Google need to come up with new strategic solutions to the early resolution of uncertainty around the status quo.
In recent times, tripartite regulatory agencies such as the U.S. Justice Department, Federal Trade Commission, and Senate and House Judiciary Committees probe into antitrust concerns over F.A.M.G.A. with respect to their platform architecture and market power and dominance. Congressional committee members focus on whether these top tech titans abuse their economic clout to crush rivals in social media, e-commerce, software, Internet search, facial recognition, voice recognition, natural language, and artificial intelligence. Antitrust scrutiny and tech compliance arise from the sheer size and power of F.A.M.G.A. and thus remain key bipartisan regulatory issues in America.
F.A.M.G.A. represent more than $4 trillion stock market valuation (or almost 15% of U.S. stock market capitalization), and also amass more than $180 billion in pre-tax profits (or 10% of pre-tax profits made by U.S. public corporations). In recent years, F.A.M.G.A. have spent billions buying rivals to stifle business competition and innovation. The major M&A deals include:
(1) the $20 billion acquisitions of Instagram, WhatsApp, and Oculus by Facebook;
(2) the $15 billion acquisitions of Whole Foods Market and PillPack by Amazon;
(3) the $45 billion acquisitions on LinkedIn, Skype, GitHub, and Nokia by Microsoft;
(4) the $16 billion acquisitions of DeepMind, Motorola, and Nest by Google; and
(5) the $10 billion acquisitions of Semetric Music, Shazam, and Turi etc by Apple.
Amazon and Google now face more intense antitrust scrutiny in America. In recent times, U.S. Justice Department and Federal Trade Commission agree to conduct independent antitrust investigations into the tech titans. Justice Department takes responsibility for Google antitrust matters, and Federal Trade Commission handles Amazon in light of potential consumer harm. This key internal agreement presages stricter antitrust rules and regulations.
Google already suffers antitrust punitive fines and penalties in Europe due to the E.U. charges that the Internet search algorithms favor Google software products. In contrast, U.S. antitrust law focuses on the broader notion of consumer protection; however, smart algorithms help constrain Amazon retail price hikes. Federal Trade Commission conveys concern and suspicion that both the sheer size and market power of Amazon may induce anti-competitive ripple effects.
Justice Department, Federal Trade Commission, and Senate and House Judiciary Committees either stimulate more competition in e-commerce and Internet search, or these regulatory agencies may consider breaking up Amazon and Google. A plausible future scenario may entail the clear separation of Amazon cloud services from the e-commerce marketplace. For Google, the online search engine may be kept separate from many other online software services such as Chrome, G-Suite, Google Cloud, Google Assistant, and Google Search Console etc.
In Europe, Amazon faces E.U. antitrust scrutiny over the current e-commerce use of merchant data. Under GDPR, the European Commission probes into whether Amazon uses key third-party seller data to promote its products to the detriment of other retailers. This antitrust investigation serves as an incremental step toward better characterizing Amazon cross-border e-commerce business practices. The current preliminary inquiry helps reveal how tech titans such as Amazon may use customer information to reinforce their market power and dominance.
The core concern arises form negative feedback from European third-party sellers, retailers, and manufacturers that Amazon has been trying to abuse its dual role as a direct e-commerce competitor and also as an online marketplace for merchants. Under the current Amazon terms of service for Europe, third-party sellers and other merchants grant Amazon royalty-free rights to use their own product information, content, technology, and even trademark logo design.
European Competition Commissioner Margrethe Vestager suggests that global e-commerce platforms must not eliminate consumer benefits such as better product prices and broader choices via anti-competitive business practices. E.U. regulators can impose fines up to 10%-15% of global sales; however, some antitrust experts indicate the essential need for European Commission to establish a new precedent of keystone industry standards and best practices for cross-border e-commerce.
Amazon CEO Jeff Bezos admits the fact that antitrust scrutiny remains a primary imminent threat to his global e-commerce business empire. In his annual letter to Amazon shareholders, Bezos points out that the percentage of Amazon goods sold by independent third-parties has gone from 3% in 1999 to almost 60% in mid-2019. Also, Bezos emphasizes the essential need for Amazon to fail fast forward to grow exponentially with the socioeconomic impact of revolutionary inventions such as artificial intelligence, robotic automation, the core strategic healthcare venture with Berkshire Hathaway and JPMorgan Chase, and the landmark acquisition of Whole Foods Market. With respect to stakeholder value maximization, Bezos plans to pay Amazon employees, upstream suppliers, and downstream customers with more favorable terms, wages, returns, and benefits.
Facebook reaches a $5 billion settlement with Federal Trade Commission (FTC) over Cambridge Analytica user privacy violations. FTC probes into prevalent user privacy practices across the key social media ecosystem of Facebook, Messenger, Instagram, and WhatsApp etc. FTC commissioners break along party lines, 3-to-2, as the GOP majority votes line up to support the $5 billion punitive penalty. The Cambridge Analytica data debacle may have compromised the personal data for about 87 million Facebook users worldwide. FTC requires Facebook to establish a new independent Privacy Committee of directors on the current corporate board. This committee would oversee all of the necessary audit functions to ensure strict compliance with keystone FTC consumer privacy rules and best practices.
U.S. regulatory agencies consider broader economic concerns and issues in their antitrust investigations.
In recent years, U.S. regulatory agencies can begin to consider broader economic issues in their antitrust probe into tech titans such as Amazon, Apple, Facebook, and Google etc. The main theme suggests that these tech companies may abuse their quasi-monopoly power with suspicious anti-competitive behaviors. Federal Trade Commission and Justice Department focus on how Facebook and Google affect consumer privacy and competitor survival across the news media landscape. These regulatory agencies also probe into whether Apple abuses its market power in close collaboration with Spotify to dominate digital music and the key iOS-iTunes app ecosystem. Moreover, Senate and House Judiciary Committees express their grave concern that Amazon not only institutes arbitrary retail price adjustments on the global e-commerce platform from time to time but also conducts collusive price schemes in e-commerce.
Antitrust scrutiny continues to be one of the biggest bipartisan tech policy issues. The vast majority of Democrats and Republicans support the inter-agency antitrust investigations (although some conservative senators attempt to avoid excessive government intervention). The regulatory agencies may impose punitive fines and penalties to diminish the market power of the top tech titans, or may break up some of the tech titans for better consumer welfare, competitor survival, and longer-term business innovation.
Harvard economic platform researcher proposes alternative solutions to breaking up tech titans.
Harvard economic platform researcher Dipayan Ghosh proposes some alternative solutions to breaking up tech titans such as Facebook, Apple, Microsoft, Google, and Amazon (F.A.M.G.A.). Breaking up the tech titans would only serve to punish innovative tech enterprises that have already created tremendous economic value. F.A.M.G.A. have become quasi-monopolies that necessitate a new and stringent set of utility regulations for better privacy protection and personal data usage. In fact, these utility regulations may obstruct the capitalistic overreaches of tech titans in order to protect the American general public against economic exploitation. With F.A.M.G.A, their current platform infrastructure makes it extraordinarily difficult for new entrants to offer competitive levels of transformative consumer utility. These tech titans extract consumer currency on the basis of personal data and attention. Further, these tech trailblazers extract fresh consumer currency on one side of the platform, and then exchange such currency for monetary revenue at high margins on the other side of the same platform. This subtle but corrosive form of economic exploitation seems to be objectionable to U.S. Justice Department, Federal Trade Commission, and European Commission. In this light, there can be an alternative case for utility regulations in lieu of breaking up the tech titans.
Keystone stock valuation for Facebook
We apply the standard Discounting-Cash-Flows (DCF) Gordon growth model with reasonable assumptions. The long-term U.S. equity risk premium is 11%, and we expect Facebook sales and net profits to grow at 3% to 5% per annum (1% to 3% real GDP economic growth plus 2% inflation target). These generic expectations suggest a reasonable range of Free-Cash-Flows (FCF) yields 6% to 8% and are also applicable to the other top tech titans.
Given our conservative FCF estimates of $8.71 to $14.04 per share for Facebook over 2020-2022, back-of-the-envelope calculations suggest a reasonable range of share prices $145 to $175 (i.e. $8.71/6% and $14.04/8%).
Moreover, the net income per share (EPS) is likely to be between $7.9 and $8.75 per share. We apply the standard long-term U.S. stock market P/E ratios of 17x to 22x to arrive at the slightly wider reasonable range of stock prices $134 to $192.5 (i.e. $7.9*17 and $8.75*22). On balance, these reasonable ranges of stock prices are narrower than the 52-week stock price range of $123 to $208 for Facebook as of 2019Q3.
Keystone stock valuation for Google
We apply the standard Discounting-Cash-Flows (DCF) Gordon growth model with reasonable assumptions. The long-term U.S. equity risk premium is 11%, and we expect Google sales and profits to grow at 3%-5% per annum (1% to 3% real GDP economic growth plus 2% inflation target). These generic expectations suggest a reasonable range of Free-Cash-Flows (FCF) yields from 6% to 8% and are also applicable to the other top tech titans.
Given our conservative FCF estimates of $63.5 to $88.5 per share for Google over 2020-2022, back-of-the-envelope calculations show a reasonable range of stock prices $1,058 to $1,106 (i.e. $63.5/6% and $88.5/8%).
Moreover, the net income per share (EPS) is likely to be between $64 and $65 per share. We apply the standard long-term U.S. stock market P/E ratios of 17x to 22x to arrive at the wider reasonable range of stock prices $1,088 to $1,430 (i.e. $64*17 and $65*22). On balance, these reasonable ranges of FCF target stock prices are narrower than the 52-week stock price range of $977.66 to $1,190.13 for Google as of 2019Q3, whereas, the P/E calculations suggest greater upside for Google as of 2019Q3.
Keystone investment thesis and stock valuation for Amazon
As of mid-2019, Amazon beats Wall Street expectations of almost $60 billion net sales per quarter primarily due to online stores and subscriptions. Also, Amazon experiences dual increases in both 43% gross margins and 17% net profit margins in the most recent quarter. Further, Amazon CEO Jeff Bezos indicates that millions of Prime Members start to use Amazon Day as a premium service (or customer-centric delivery date). This economic trend suggests a major behavioral change in U.S. consumption and can help improve operational leverage over time. Despite some foreign exchange headwinds, Amazon continues to benefit from fresh hefty investments in one-day shipments, Prime sub-additions, low churn rates, and more frequent international customer purchases.
In addition to the e-commerce business, Amazon Web Services (AWS) continue to grow in line with Wall Street topline expectations. AWS continues to secure big contracts from well-known companies such as Netflix, Twitch, LinkedIn, Facebook, BBC, Baidu, ESPN, Gogo, Lyft, Second Spectrum, and so on. Many stock market analysts and investors expect AWS to maintain its current cloud market dominance in direct competition with Alibaba, Dell, Google, IBM, Microsoft, Oracle, Salesforce, and Verizon etc.
We can identify several competitive threats and risks for Amazon in the next few years. First, Amazon worldwide premium unit growth decelerates for 7 consecutive quarters as of 2019Q2. This fundamental factor poses a potential threat to topline revenue expectations in addition to foreign exchange headwinds. Second, it is still difficult for Amazon to tap into the fresh territory of Internet advertisement in direct competition with the bigger players Facebook and Google. Amazon can leverage its current global e-commerce platform to reap reasonable rewards in the form of online ad sales, whereas, any new off-site ad revenue remains rare and miniscule. Third, third-party seller services continue to slow from 28% to 23% as international sales start to trail Wall Street expectations.
In addition to these competitive threats and risks, Amazon CEO Jeff Bezos admits that antitrust scrutiny continues to represent the biggest challenge to the dual tech titan in e-commerce and cloud service provision. At this stage, it is quite plausible for Amazon stock investors to expect new rules and regulations, and even punitive fines and penalties, that both U.S. and European antitrust regulatory agencies may impose on Amazon (and several other tech titans) in the foreseeable future. Stock market investors need to be wary as these economic developments emerge in the next few years.
We apply the standard Discounting-Cash-Flows (DCF) Gordon growth model with reasonable assumptions. The long-term U.S. equity risk premium is 11%, and we expect Amazon sales and net profits to grow at 3% to 5% per annum (1% to 3% real GDP economic growth plus 2% inflation target). These generic expectations suggest a reasonable range of Free-Cash-Flows (FCF) yields 6% to 8% and are also applicable to the other top tech titans.
Given our conservative FCF estimates of $83 to $97 per share for Amazon over 2020-2022, back-of-the-envelope calculations show a reasonable range of stock prices $1,213 to $1,383 (i.e. $83/6% and $97/8%).
Moreover, the net income per share (EPS) is likely to be about $87 per share. We apply the standard longer-term U.S. stock market P/E ratios of 17x to 22x to arrive at the slightly wider reasonable range of stock prices $1,479 to $1,914 (i.e. $87*17 and $87*22). On balance, these reasonable ranges of stock prices are narrower than the 52-week stock price range of $1,307 to $2,036 for Amazon as of 2019Q3.
Keystone investment thesis and stock valuation for Apple
We delve into the pros and cons of investing in Apple equity stakes over the long run. Apple has a virtual monopoly over the wealthiest 15% of citizens in the world. Apple benefits substantially from positive network effects due to the global trend toward ubiquitous mobile device adoption. Also, Apple is an aspirational high-end brand that challenges the status quo for the younger and tech-savvy generations. Much of Apple mobile device pricing power emerges from its widespread premier brand recognition and superior customer experience.
Apple refrains from tapping into the uncharted territory of Internet advertisement. Apple protects active user data privacy and personal information. For smart mobile communication, Apple uses end-to-end encryption to ensure compliance with the highest data integrity standards for financial data, credit card data, and personal health information. In recent years, facial recognition further contributes to better personal privacy protection with active user authentication.
Apple focuses on core inventive elements, features, and services for lower user churn rates and higher platform metrics such as average revenue per user (ARPU), average profit per user (APPU), average duration of active mobile usage per week, customer acquisition, customer retention, and so forth. Each incremental product and service empowers Apple to improve its overall profitability on a per capita basis. This incrementalism reduces active user churn rates and so renders the entire iOS ecosystem stickier in the minds of Apple mobile users. Also, the first Apple product leads to the highest upfront cost of customer acquisition, whereas, the next 2 to 4 Apple products and services can yield higher incremental profit margins as these additions help reduce the average costs of both customer acquisition and retention (cf. positive network effects and scale economies).
As of mid-2019, Apple introduces fresh multi-media services to curate better video content across about 1.4 billion mobile devices worldwide. With high profit margins of 63% per annum, these multi-media services help double the lifetime value per user. With its lean startup team strategy, Apple strives to make iterative continuous improvements and feature enhancements for iPhones, iPads, iTunes, HomePods, MacBooks, and other smart mobile devices. Given the current global demand for these smart mobile devices, Apple offers at least 3 iPhone models as sequels for better product market segmentation. These sequels empower iOS users to follow the typical product lifecycle of almost 4-5 years for each iPhone. Specifically, this sequel strategy constrains the downside risk of hits, each of which may be only a transient flash in the pan.
Apple continues to keep a bullet-proof fortress balance sheet. In the broad context of chaotic global macro economic developments, the enormous net cash balance (after debt) of about $130 billion safeguards most macro disruptions. Also, this net cash position allows Apple to consider new prospective M&A deals, especially in multi-media services and exclusive licenses for Apple Music and Apple TV. How Apple translates its current net cash capital into new forms of competitive moats via mergers and acquisitions remains a key priority from 2020 to 2025.
Apple CEO Tim Cook has skillfully transformed the Steve Jobs legacy of holistic product development (hardware, software, artificial intelligence, services, features, and other inventive elements etc) into the annual iPhone trifecta with competitive tablets iPads, multi-media services Apple Music and Apple TV, and iOS apps via App Store. This broader product diversification enriches the digital lives of billions of Apple users and consumers worldwide. Hence, Apple mobile devices and media services not only contribute to customer delight but also better risk management.
We now consider the potential risks to Apple stock market valuation. First, global macro economies may face some unforeseen challenges such as economic policy uncertainty around Brexit, supply chain disruption in China and Hong Kong, and geopolitical tension in Iran, Turkey, and North Korea. These geopolitical risks may force Apple to consider lower premium price points for core iPhones, iPads, iTunes, HomePods, MacBooks, and so forth. In turn, the negative ripple effects can result in lower sales and net profits across the iOS platform ecosystem.
Second, Apple continues to face fierce competition from Samsung, Huawei, Oppo, Vivo, Xiaomi, Google, and others in the market for smart mobile devices. In recent years, Apple claims pyrrhic victory over the iPhone patent lawsuit settlement with Samsung in America. Several non-U.S. patent lawsuits against Apple continue to be nagging concerns that may disrupt offshore business operations.
Third, Apple iPhones and iPads serve as almost perfect substitutes for iPods. The former appear to make the latter obsolete as they offer substantially similar product features. This product line substitution may inadvertently cannibalize sales and net profits over time. In this light, the next revolutionary transformation should catapult iPhones, iPads, and HomePods to the higher-end market for smart mobile devices, whereas, iPods gradually depreciate to become the next anachronism (in the likes of analog cameras and mainframe computers etc).
Fourth, Apple iPhones and iPads continue to be technically inferior to core Android mobile devices because there are almost 24,000 other Android substitutes. Apple must further differentiate its flagship iPhones and iPads with greater software and media service integration of App Store, Apple Music, and Apple TV etc. In the long run, the post-Jobs legacy success of key holistic product development depends on whether Apple can offer unique smart products and services that iOS users cannot perceive as close substitutes to numerous Android alternatives.
Finally, Apple transforms its current business model to incorporate $5-only online subscriptions to Apple TV. This strategic move competes with the wider consumer adoption of Disney, HBO, Hulu, Netflix, and Spotify etc. In the modern era of digital technology proliferation, millennials prefer to rent smart products and services in lieu of direct asset ownership (e.g. Airbnb and Uber). Hence, several stock market analysts and economic commentators expect Apple to bundle at least some iOS iPhones, iPads, iTunes, HomePods, MacBooks, and multimedia services from App Store to Apple Music and Apple TV. This product strategy can empower Apple to cause active users to stick to the iOS platform ecosystem.
We apply the standard Discounting-Cash-Flows (DCF) Gordon growth model with reasonable assumptions. The long-term U.S. equity risk premium is 11%, and we expect Apple sales and net profits to grow at 3% to 5% per annum (1% to 3% real GDP economic growth plus 2% inflation target). These generic expectations show a reasonable range of Free-Cash-Flows (FCF) yields of 6%-8% and are applicable to the other top tech titans.
Given our conservative FCF estimates of $10.76 to $17.5 per share for Apple over 2020-2022, back-of-the-envelope calculations show a reasonable range of stock prices $179 to $218.75 (i.e. $10.76/6% and $17.5/8%).
Moreover, the net income per share (EPS) is likely to be about $11.65 per share. We apply the standard long-run U.S. stock market P/E ratios of 17x to 22x to arrive at the wider reasonable range of stock prices $198 to $256.3 (i.e. $11.65*17 and $11.65*22). On balance, these key reasonable ranges of stock prices are narrower than the 52-week stock price range of $142 to $237.6 for Apple as of 2019Q3.
Keystone investment thesis and stock valuation for Microsoft
We delve into the pros and cons of investing in Microsoft equity stakes over the long run. Microsoft retains a quasi-monopoly over the Windows operating system and Office 365 software suite. Also, Microsoft continues to experience consistent momentum in Azure commercial cloud and Windows OEM services. Several major positive developments arise from the broad competitive landscape. First, Microsoft experiences 33% annual growth in commercial contracts and cloud services. This impressive growth represents the highest level in 5 years. Specifically, commercial cloud revenue growth reaches 41% per annum, and this momentum results in a hefty 5% increase in the gross margin for Azure.
Second, Microsoft Office commercial contracts grow at 27% per year with no sign of near-term deceleration. Office revenue growth remains at 14% as of 2019Q3 (in stark comparison to 11% about one year ago). These structural changes lead to a notable increase in the average revenue per unit (ARPU) primarily due to customer migration to premium E3 and E5 offers.
Third, Microsoft receives impressive transactional results for Windows, Office, and Surface purchases in Japan. These key results manifest in the form of double-digit growth rates well ahead of the consumption tax hike from 8% to 10%. Many stock market analysts and economic commentators regard this impressive growth as a temporal ripple effect on Microsoft software sales in East Asia.
We now turn to the potential risks and threats to Microsoft stock market valuation. First, Microsoft extracts lower net revenue from online video games due to weaker monetization across third-party titles and video console sales. Second, the recent geopolitical risks and trade disputes cause foreign exchange headwinds across most business segments. Third, Microsoft may experience some temporary cash capital shortfalls, whereas, PP&E expenses continue to be consistent with forward guidance. Finally, Microsoft may need to bundle some software products such as Office 365 with Surface tablets and cloud services to better monetize the current mix of both consumer and enterprise software suites.
We apply the standard Discounting-Cash-Flows (DCF) Gordon growth model with reasonable assumptions. The long-term U.S. equity risk premium is 11%, and we expect Microsoft sales and net profits to grow at 3% to 5% per annum (1% to 3% real GDP economic growth plus 2% inflation target). These generic expectations show a reasonable range of Free-Cash-Flows (FCF) yields 6% to 8% and are also applicable to the other top tech titans.
Given our conservative FCF estimates of $7.5 to $10.5 per share for Microsoft over 2020-2022, back-of-the-envelope calculations show a reasonable range of stock prices $125 to $131.25 (i.e. $7.5/6% and $10.5/8%).
Moreover, the net income per share (EPS) is likely to be about $6.3-$6.5 per share. We apply the standard long-run U.S. stock market P/E ratios of 17x to 22x to arrive at the wider reasonable range of target stock prices $107 to $143 (i.e. $6.3*17 and $6.5*22). On balance, these reasonable ranges of stock prices are narrower than the 52-week stock price range of $94 to $142 for Microsoft as of 2019Q3.
As of mid-2019, we list our proprietary dynamic conditional alphas for the U.S. top tech titans Facebook, Apple, Microsoft, Google, and Amazon (F.A.M.G.A.). Our key proprietary alpha stock signals empower investors to better balance their stock portfolios. This balance helps gauge each alpha, or the supernormal excess stock return to the standard smart beta stock investment strategy. The exclusive strategy minimizes beta exposure to size, value, momentum, asset growth, cash profitability, and the market risk premium. Our unique proprietary algorithmic system for asset return prediction relies on U.S. trademark and patent protection and enforcement.
(1) 19.31% dynamic conditional alpha for Facebook;
(2) 30.88% dynamic conditional alpha for Apple;
(3) 33.99% dynamic conditional alpha for Microsoft;
(4) 27.10% dynamic conditional alpha for Google; and
(5) 21.53% dynamic conditional alpha for Amazon.
Do you find it difficult to beat the long-term average 11% stock market return?
It took us 20+ years to design a new profitable algorithmic asset investment model and its attendant proprietary software technology with fintech patent protection in 2+ years. AYA fintech network platform serves as everyone’s first aid for his or her personal stock investment portfolio. Our proprietary software technology allows each investor to leverage fintech intelligence and information without exorbitant time commitment. Our dynamic conditional alpha analysis boosts the typical win rate from 70% to 90%+.
Our new alpha model empowers members to be a wiser stock market investor with profitable alpha signals! The proprietary quantitative analysis applies the collective wisdom of Warren Buffett, George Soros, Carl Icahn, Mark Cuban, Tony Robbins, and Nobel Laureates in finance such as Robert Engle, Eugene Fama, Lars Hansen, Robert Lucas, Robert Merton, Edward Prescott, Thomas Sargent, William Sharpe, Robert Shiller, and Christopher Sims.
Follow AYA Analytica financial health memo (FHM) podcast channel on YouTube: https://www.youtube.com/channel/UCvntmnacYyCmVyQ-c_qjyyQ
Follow our Brass Ring Facebook to learn more about the latest financial news and fantastic stock investment ideas: http://www.facebook.com/brassring2013.
Free signup for stock signals: https://ayafintech.network
Mission on profitable signals: https://ayafintech.network/mission.php
Model technical descriptions: https://ayafintech.network/model.php
Blog on stock alpha signals: https://ayafintech.network/blog.php
Freemium base pricing plans: https://ayafintech.network/freemium.php
Signup for periodic updates: https://ayafintech.network/signup.php
Login for freemium benefits: https://ayafintech.network/login.php
We update and refresh part of memetic financial information on a sporadic basis. We aim to facilitate this information exchange only for illustrative purposes. Some information may be stale and incomplete. Therefore, we recommend each member to consult the respective external website(s) for more up-to-date information.
This analytic report cannot constitute any form of financial advice, analyst opinion, recommendation, or endorsement. We refrain from engaging in financial advisory services, and we seek to offer our analytic insights into the latest economic trends, stock market topics, investment memes, and other financial issues. Our proprietary alpha investment algorithmic system helps enrich our AYA fintech network platform as a new social community for stock market investors: https://ayafintech.network.
The conventional disclaimers apply to this key case where each freemium member bewares, understands, and acknowledges the service terms and conditions for our courteous fintech network platform. Any omissions, errors, or other blemishes do not necessarily reflect the official views and opinions of our AYA fintech platform orchestrator. We make a conscious effort to keep most major omissions to 1% to 5% of the fintech information for about 6,000 U.S. stocks on NYSE, NASDAQ, and AMEX. These omissions tend to concentrate around some rare corporate events (e.g. IPO, delisting occurrence and recurrence, abrupt trading suspension, and M&A initiation etc). Overall, these disclaimers, terms, and conditions of our service should be viewed as baseline house rules for fintech network platform usage and development.
Under pending subsequent patent-law confirmation, the relevant legal text protects our proprietary alpha software technology for ubiquitous knowledge transfer. Each freemium member enjoys his or her interactive usage and information exchange on our AYA algorithmic fintech network platform with sound and efficient dynamic conditional asset return prediction.
Our AYA fintech network platform helps promote better financial literacy, inclusion, and freedom of the global general public with an abiding interest in core economic reforms, financial markets, and stock market investments. In this broader context, each freemium member can consult our mission statement that provides more in-depth explanatory details on our long-term aspiration.
If any of our AYA Analytica financial health memos (FHM), blog posts, ebooks, newsletters, and notifications etc, or any other form of online content curation, involves potential copyright concerns, please feel free to contact us at service@ayafintech.network so that we can remove relevant content in response to any such request within a reasonable time frame.
2018-03-17 09:35:00 Saturday ET
Facebook faces a major data breach by Cambridge Analytica that has harvested private information from more than 50 million Facebook users. In a Facebook pos
2023-03-21 11:28:00 Tuesday ET

Barry Eichengreen compares the Great Depression of the 1930s and the Great Recession as historical episodes of economic woes. Barry Eichengreen (2016)
2020-01-01 13:39:00 Wednesday ET

President Trump approves a phase one trade agreement with China. This approval averts the introduction of new tariffs on Chinese imports. In return, China s
2025-10-09 11:30:00 Thursday ET
Stock Synopsis: With a new Python program, we use, adapt, apply, and leverage each of the mainstream Gemini Gen AI models to conduct this comprehensive fund
2027-10-31 00:00:00 Sunday ET

In the technological race between the U.S. and China, America leads in some strategic sectors from AI large language models (LLM), graphics processing units
2025-10-06 10:27:00 Monday ET
Stock Synopsis: With a new Python program, we use, adapt, apply, and leverage each of the mainstream Gemini Gen AI models to conduct this comprehensive fund