2023-05-14 12:31:00 Sunday ET
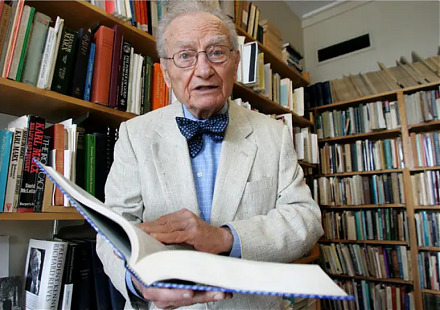
Paul Samuelson defines the mathematical evolution of economic price theory and thereby influences many economists in business cycle theory and macro asset m
2018-07-13 09:41:00 Friday ET
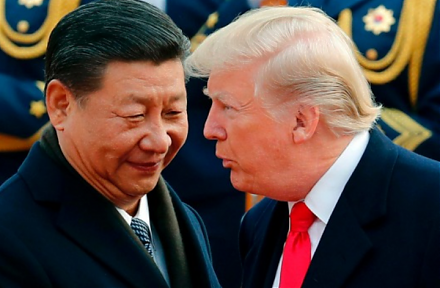
Yale economist Stephen Roach warns that America has much to lose from the current trade war with China for a few reasons. First, America is highly dependent
2019-11-06 12:29:00 Wednesday ET

Our fintech finbuzz analytic report shines fresh light on the fundamental prospects of U.S. tech titans Facebook, Apple, Microsoft, Google, and Amazon (F.A.
2020-08-19 10:32:00 Wednesday ET

Corporate strategies, portfolio choices, and management memes add value and drive business process improvements over time. Andrew Campbell, Jo Whitehead,
2020-10-20 09:36:00 Tuesday ET

Agile lean enterprises remain flexible and capable of reinvention in light of new megatrends such as digitization and servitization. Shane Cragun and Kat
2023-12-05 09:25:00 Tuesday ET

Better corporate ownership governance through worldwide convergence toward Berle-Means stock ownership dispersion Abstract We design a model