2019-11-13 11:34:00 Wednesday ET
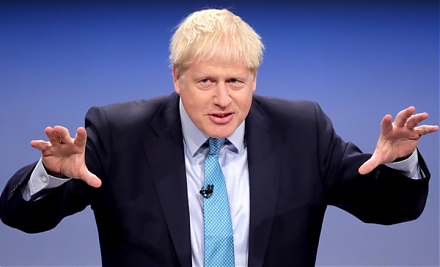
The new Brexit deal can boost British pound appreciation and economic optimism. British prime minister Boris Johnson wins the parliamentary vote on his new
2017-08-19 14:43:00 Saturday ET
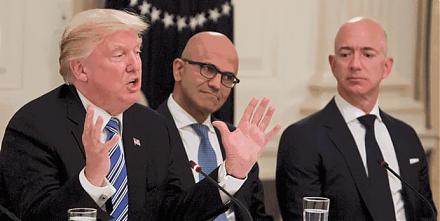
In a recent tweet, President Donald Trump criticizes Amazon over taxes and jobs. Without providing specific evidence, Trump accuses of the e-commerce retail
2018-03-13 07:34:00 Tuesday ET
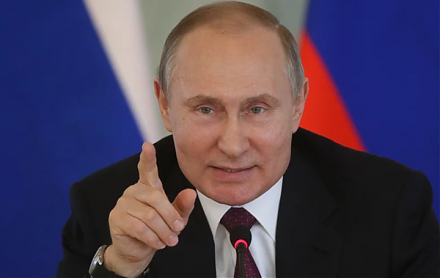
From crony capitalism to state capitalism, what economic policy lessons can we learn from President Putin's current reign in Russia? In the 15 years of
2022-10-15 09:34:00 Saturday ET

Internal capital markets and financial constraints Duchin (JF 2010) empirically finds that multidivisional firms with robust internal capital markets ret
2025-10-12 13:32:00 Sunday ET

Stock Synopsis: With a new Python program, we use, adapt, apply, and leverage each of the mainstream Gemini Gen AI models to conduct this comprehensive fund
2024-02-05 11:26:00 Monday ET
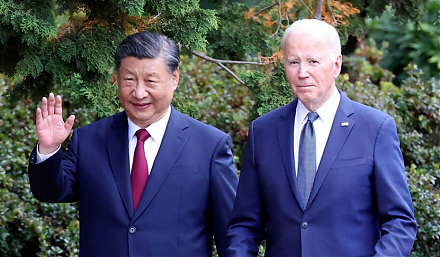
China poses new economic, technological, and military threats to the U.S. and many western allies. In the U.S. government assessment, China poses new eco