2017-06-03 05:35:00 Saturday ET
Fundamental value investors, who intend to manage their stock portfolios like Warren Buffett and Peter Lynch, now find it more difficult to ferret out indiv
2018-07-13 09:41:00 Friday ET
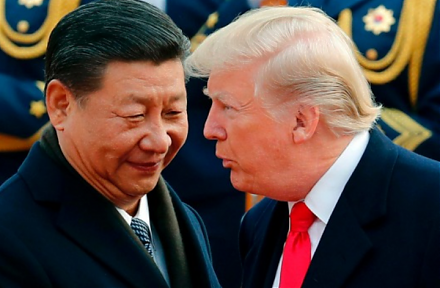
Yale economist Stephen Roach warns that America has much to lose from the current trade war with China for a few reasons. First, America is highly dependent
2023-11-14 08:24:00 Tuesday ET
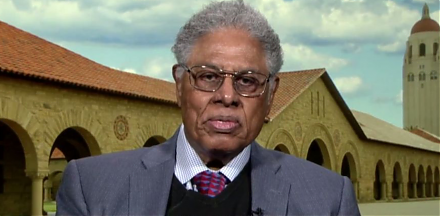
Thomas Sowell argues that some economic reforms inadvertently exacerbate economic disparities. Thomas Sowell (2019) Discrimination and econo
2018-01-07 09:33:00 Sunday ET
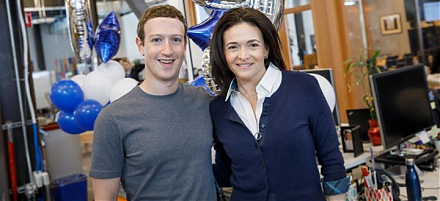
Zuckerberg announces his major changes in Facebook's newsfeed algorithm and user authentication. Facebook now has to change the newsfeed filter to prior
2018-04-07 09:36:00 Saturday ET
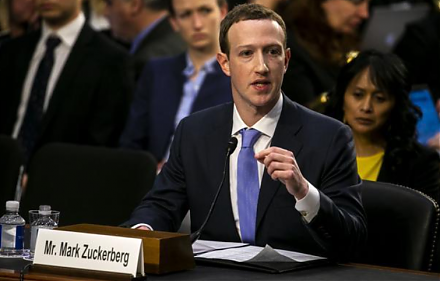
Facebook CEO Mark Zuckerberg testifies in Congress to rise up to the challenge of public outrage in response to the Cambridge Analytica data debacle and use
2019-02-17 14:40:00 Sunday ET

U.S. economic inequality increases to pre-Great-Depression levels. U.C. Berkeley economics professor Gabriel Zucman empirically finds that the top 0.1% rich