2019-07-27 17:37:00 Saturday ET
Capital gravitates toward key profitable mutual funds until the marginal asset return equilibrates near the core stock market benchmark. As Stanford finance
2019-06-13 10:26:00 Thursday ET

The Chinese Xi administration may choose to leverage its state dominance of rare-earth elements to better balance the current Sino-U.S. trade war. In recent
2019-05-19 19:31:00 Sunday ET

MIT professor and co-author Daron Acemoglu suggests that economic prosperity comes from high-wage job creation. Progressive tax redistribution cannot achiev
2018-05-04 06:29:00 Friday ET
Commerce Secretary Wilbur Ross suggests that 5G remains a U.S. top technology priority in light of the telecom merger proposal between Sprint and T-Mobile a
2017-12-01 06:30:00 Friday ET

Dr Kai-Fu Lee praises China as the next epicenter of artificial intelligence, smart data analysis, and robotic automation. With prior IT careers at Apple, M
2018-12-05 09:38:00 Wednesday ET
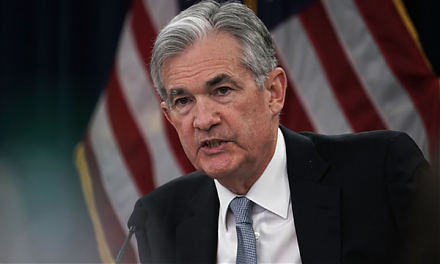
Federal Reserve publishes its inaugural flagship financial stability report. Fed Chair Jerome Powell applauds both low inflation (2%) and low unemployment (