2017-02-07 07:47:00 Tuesday ET

With prescient clairvoyance, Bill Gates predicted the recent sustainable rise of Netflix and Facebook during a Playboy interview back in 1994. He said th
2018-01-05 07:37:00 Friday ET
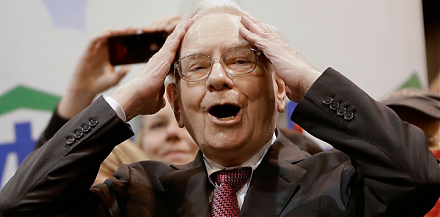
Warren Buffett cleverly points out that American children will not only be better off than their parents, but the former will also enjoy higher living stand
2019-10-11 13:40:00 Friday ET
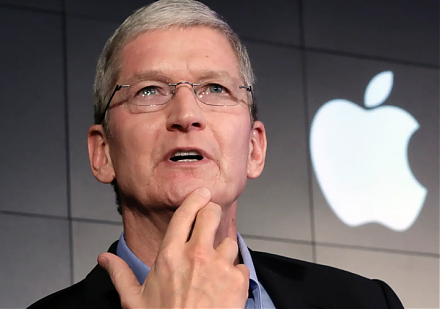
Apple CEO Tim Cook maintains a frugal low-key lifestyle. With $625 million public wealth, Cook leads the $1 trillion tech titan Apple in the post-Jobs era.
2017-12-11 08:42:00 Monday ET
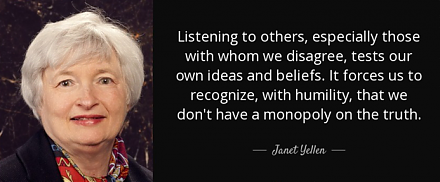
Fed Chair Janet Yellen says the current high stock market valuation does not mean overvaluation. A stock market quick fire sale would pose minimal risk to t
2018-11-21 11:36:00 Wednesday ET

Apple upstream suppliers from Foxconn and Pegatron to Radiance and Lumentum experience sharp share price declines during the Christmas 2017 holiday quarter.
2017-08-01 09:40:00 Tuesday ET
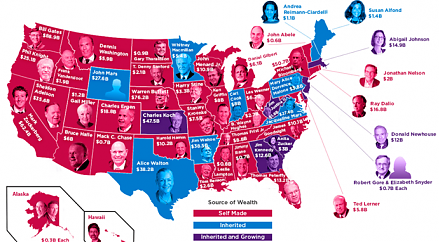
In American states, all of the Top 4 richest people are self-made billionaires: Bill Gates in Washington, Warren Buffett in Nebraska, Michael Bloomberg in N