2022-05-25 09:31:00 Wednesday ET

Net stock issuance theory and practice Net equity issuance can be in the form of initial public offering (IPO) or seasoned equity offering (SEO). This l
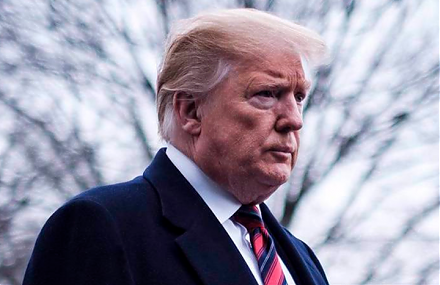
2018-11-13 12:30:00 Tuesday ET

President Trump promises a great trade deal with China as Americans mull over mid-term elections. President Trump wants to reach a trade accord with Chinese
2018-06-06 09:39:00 Wednesday ET
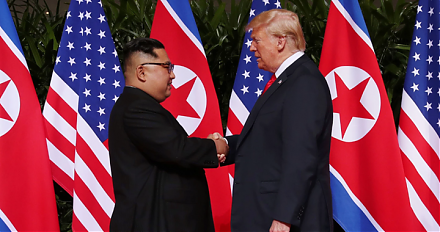
Donald Trump and Kim Jong Un meet, talk, and shake hands in the historic peace summit between America and North Korea in Singapore. At the start of the bila
2018-09-27 11:41:00 Thursday ET
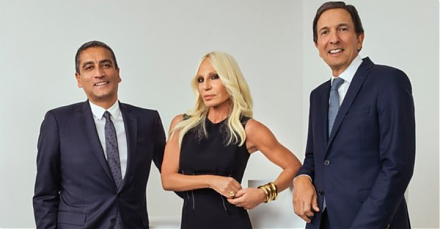
Michael Kors pays $2.3 billion to acquire the Italian elite fashion brand Versace. In accordance with Michael Kors's 5-year plan, the joint company grow
2018-05-01 11:38:00 Tuesday ET
America and China play the game of chicken over trade and technology, whereas, most market observers and economic media commentators hope the Trump team to
2019-11-21 11:34:00 Thursday ET
Berkeley macro economist Brad DeLong sees no good reasons for an imminent economic recession with mass unemployment and even depression. The current U.S. ec