2024-02-05 11:26:00 Monday ET

China poses new economic, technological, and military threats to the U.S. and many western allies. In the U.S. government assessment, China poses new eco
2025-07-12 11:35:00 Saturday ET
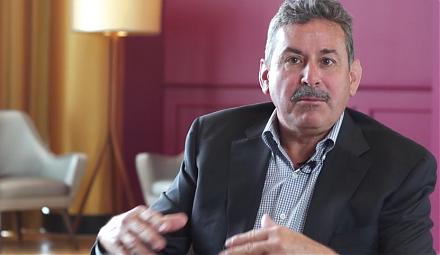
Mitch Anthony explains why it is now more important for top sales leaders to apply social skills and emotional competences to fulfill customer needs, wants,
2023-02-03 08:27:00 Friday ET

Our proprietary alpha investment model outperforms most stock market indices from 2017 to 2023. Our proprietary alpha investment model outperforms the ma
2019-03-03 10:39:00 Sunday ET

Tech companies seek to serve as quasi-financial intermediaries. Retail traders can list items for sale on eBay and then acquire these items economically on
2019-09-19 15:30:00 Thursday ET

U.S. yield curve inversion can be a sign but not a root cause of the next economic recession. Treasury yield curve inversion helps predict each of the U.S.
2019-09-13 10:37:00 Friday ET
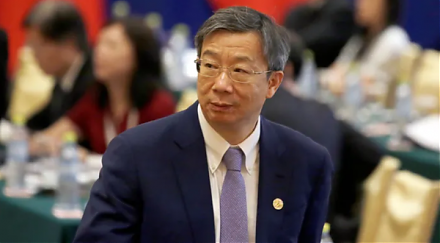
China allows its renminbi currency to slide below the key psychologically important threshold of 7-yuan per U.S. dollar. A currency dispute between the U.S.