2025-07-26 09:26:00 Saturday ET

Nir Eyal and Ryan Hoover explain why keystone habits lead us to purchase products, goods, and services in our lives. The Hooked Model can help shine new lig
2019-09-21 09:25:00 Saturday ET

President Trump praises great unity and progress at the G7 summit with respect to Sino-U.S. trade conflict resolution, global climate change, containment fo
2023-07-28 11:28:00 Friday ET

Lucian Bebchuk and Jesse Fried critique that executive pay often cannot help explain the stock return and operational performance of most U.S. public corpor
2017-10-21 08:45:00 Saturday ET

Netflix stares at higher content costs as Disney and Fox hold merger talks. Disney has held talks to acquire most of 21st Century Fox's business equity.
2017-06-15 07:32:00 Thursday ET
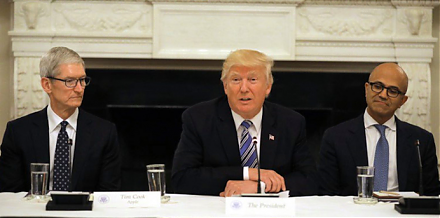
President Donald Trump has discussed with the CEOs of large multinational corporations such as Apple, Microsoft, Google, and Amazon. This discussion include
2019-04-01 08:28:00 Monday ET

OraSure and its subsidiary DNA Genotek specialize in the lean production of home DNA spit tubes. OraSure extracts core genetic information from microbiome s