2018-07-07 10:33:00 Saturday ET

The east-west tech rivalry intensifies between BATs (Baidu, Alibaba, and Tencent) and FAANGs (Facebook, Apple, Amazon, Netflix, and Google). These Sino-U.S.
2017-07-19 11:35:00 Wednesday ET
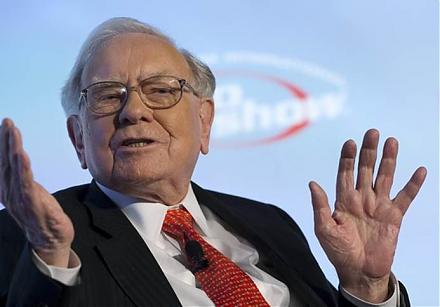
This brief article encapsulates the timeless wisdom of Warren Buffett's famous quotes on fundamental stock investment, fear and greed, patience, risk co
2019-06-11 12:33:00 Tuesday ET
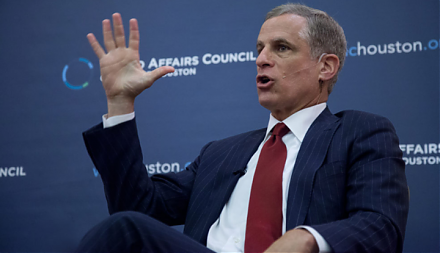
Dallas Federal Reserve Bank President Robert Kaplan expects the U.S. economy to grow at 2.2%-2.5% in 2019-2020 as inflation rises a bit. In an interview wit
2017-07-25 10:44:00 Tuesday ET

NerdWallet's new simulation suggests that a 25-year-old millennial who earns an inflation-free base salary of $40,456 and saves 15% each year faces a 99
2023-03-21 11:28:00 Tuesday ET

Barry Eichengreen compares the Great Depression of the 1930s and the Great Recession as historical episodes of economic woes. Barry Eichengreen (2016)
2018-08-01 11:43:00 Wednesday ET
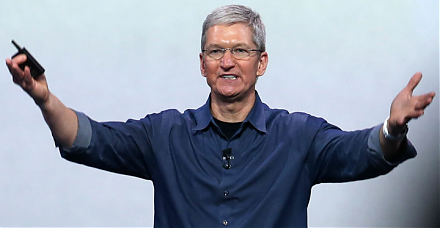
Apple becomes the first company to hit $1 trillion stock market valuation. The tech titan sells about the same number of smart phones or 41 million iPhones