2019-10-29 13:36:00 Tuesday ET

The OECD projects global growth to decline from 3.2% to 2.9% in the current fiscal year 2019-2020. This global economic growth projection represents the slo
2019-10-07 12:35:00 Monday ET
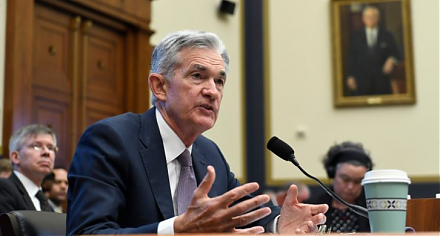
Federal Reserve reduces the interest rate by another key quarter point to the target range of 1.75%-2% in September 2019. In accordance with the Federal Res
2018-11-03 11:36:00 Saturday ET

Apple adds fresh features to its new iPad Pro and MacBook Air in addition to its prior suite of iPhone XS, iPhone XS Max, and iPhone XR back in September 20
2017-11-23 10:42:00 Thursday ET

As the TV host of Mad Money, Jim Cramer provides 5 key reasons against the purchase and use of cryptocurrencies such as Bitcoin. First, no one knows the ano
2018-01-29 07:38:00 Monday ET
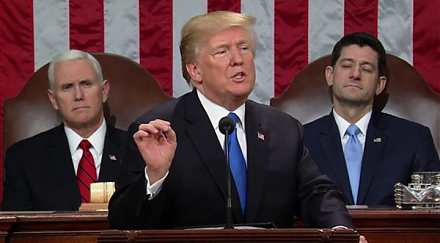
President Donald Trump delivers his first state-of-the-union address. Several key highlights touch on economic issues from fiscal stimulus and trade protect
2017-02-01 14:41:00 Wednesday ET

President Trump refreshes his public image through his presidential address to Congress with numerous ambitious economic policies in order to make America g