2018-06-06 09:39:00 Wednesday ET

Donald Trump and Kim Jong Un meet, talk, and shake hands in the historic peace summit between America and North Korea in Singapore. At the start of the bila
2019-06-30 12:37:00 Sunday ET

AYA Analytica finbuzz podcast channel on YouTube June 2019 In this podcast, we discuss several topical issues as of June 2019: (1) Federal Reserve h
2019-06-09 11:29:00 Sunday ET

St Louis Federal Reserve President James Bullard indicates that his ideal baseline scenario remains a mutually beneficial China-U.S. trade deal. Bullard ind
2020-05-05 09:31:00 Tuesday ET

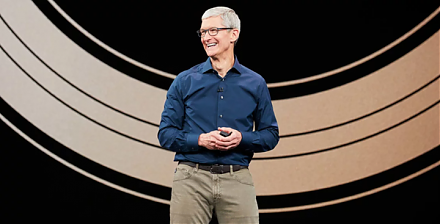
Our fintech finbuzz analytic report shines fresh light on the fundamental prospects of U.S. tech titans Facebook, Apple, Microsoft, Google, and Amazon (F.A.
2019-03-09 12:43:00 Saturday ET

Pinterest files a $12 billion IPO due in mid-2019. This tech unicorn allows users to pin-and-browse images through its social media app and website. Pintere
2018-06-11 07:44:00 Monday ET
Facebook, Apple, Amazon, Netflix, and Google (FAANG) have been the motor of the S&P 500 stock market index. Several economic media commentators contend