2019-01-11 10:33:00 Friday ET

The Economist Intelligence Unit (EIU) continues to track major business risks in light of volatile stock markets, elections, and geopolitics. EIU monitors g
2019-11-05 07:41:00 Tuesday ET
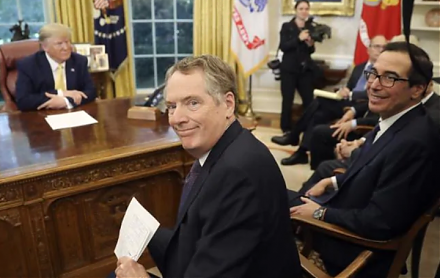
The Trump administration expects to reach an interim partial trade deal with China. This interim partial trade deal represents the first phase of a comprehe
2020-10-27 07:43:00 Tuesday ET

Most agile lean enterprises often choose to cut costs strategically to make their respective business models fit for growth. Vinay Couto, John Plansky,
2018-07-21 13:35:00 Saturday ET
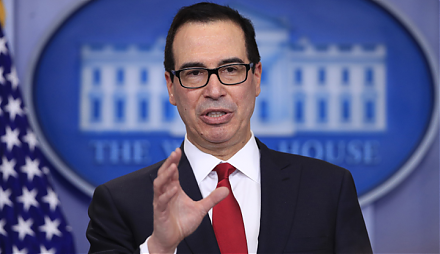
President Trump supports a bipartisan bill or the Foreign Investment Risk Review Modernization Act (FIRRMA), which effectively broadens the jurisdiction of
2018-05-03 07:34:00 Thursday ET
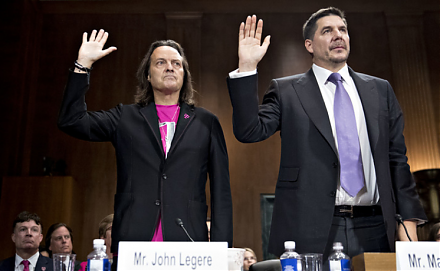
Sprint and T-Mobile propose a major merger in order to better compete with AT&T and Verizon. This mega merger is worth $26.5 billion and involves an all
2023-11-28 11:35:00 Tuesday ET

David Colander and Craig Freedman argue that economics went wrong when there was no neoclassical firewall between economic theories and policy reforms. D