2019-03-03 10:39:00 Sunday ET
Tech companies seek to serve as quasi-financial intermediaries. Retail traders can list items for sale on eBay and then acquire these items economically on
2017-01-23 09:30:00 Monday ET
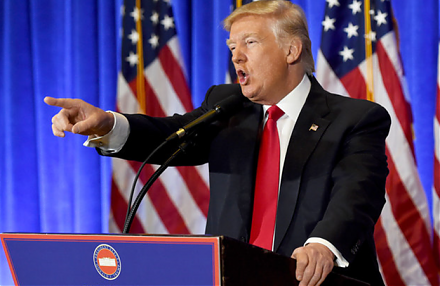
There are several highlights from the first news conference after Trump's presidential election victory: The Trump administration will repeal-and-
2020-07-26 15:29:00 Sunday ET

Firms and customers create value and wealth together by joining the continual flow of small batches of lean production to the lean consumption of cost-effec
2025-05-29 08:25:28 Thursday ET

Serial venture capitalist Ben Horowitz describes many hard truths, lessons, and insights from his entrepreneurial journey of running LoudCloud from a Silico
2019-01-04 11:41:00 Friday ET
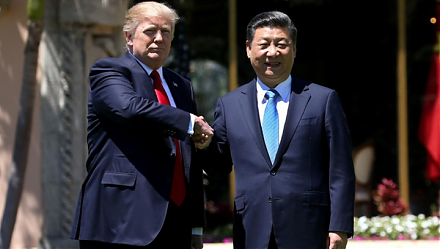
Chinese President Xi JingPing calls President Trump to reach Sino-American trade conflict resolution. Xi sends a congratulatory message to mark 40 years sin
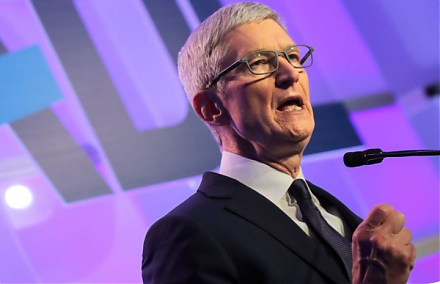
2018-01-25 08:32:00 Thursday ET

After its flagship iPhone X launch, Apple reports its highest quarterly sales revenue over $80 billion in the tech titan's 41-year history. Apple expect