2017-10-15 07:38:00 Sunday ET

Ivanka Trump and Treasury Secretary Steven Mnuchin both press the case for GOP tax legislation as economic relief for the middle-class without substantial t
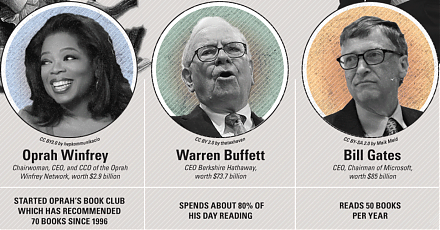
2017-06-27 05:40:00 Tuesday ET
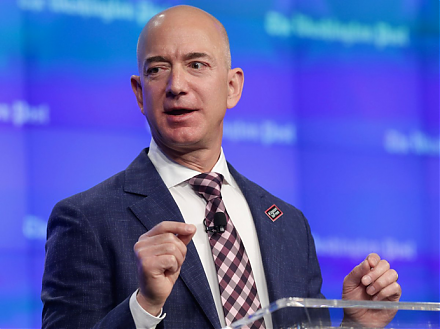
These famous quotes of self-made billionaires are inspirational words of wisdom on financial management, innovation, and entrepreneurship. For financial
2019-09-21 09:25:00 Saturday ET

President Trump praises great unity and progress at the G7 summit with respect to Sino-U.S. trade conflict resolution, global climate change, containment fo
2019-08-03 09:28:00 Saturday ET
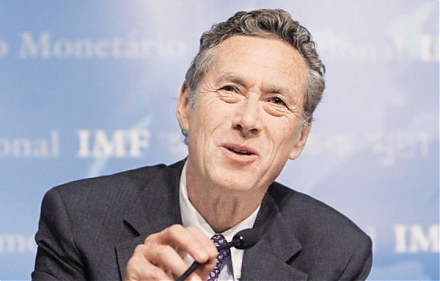
U.S. inflation has become sustainably less than the 2% policy target in recent years. As Harvard macro economist Robert Barro indicates, U.S. inflation has
2018-02-07 06:38:00 Wednesday ET
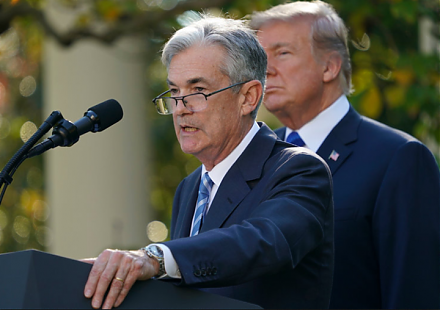
The new Fed chairman Jerome Powell faces a new challenge in the form of both core CPI and CPI inflation rate hikes toward 1.8%-2.1% year-over-year with stro
2020-02-02 10:31:00 Sunday ET
Our proprietary alpha investment model outperforms the major stock market benchmarks such as S&P 500, MSCI, Dow Jones, and Nasdaq. We implement