2018-10-03 11:37:00 Wednesday ET
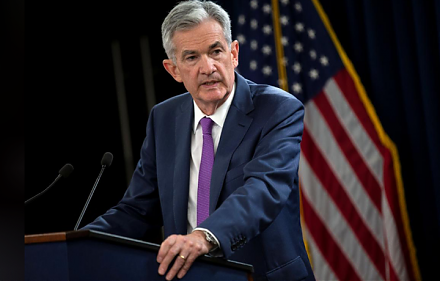
Fed Chair Jerome Powell sees a remarkably positive outlook for the U.S. economy right after the recent interest rate hike as of September 2018. He humbly su
2018-09-07 07:33:00 Friday ET
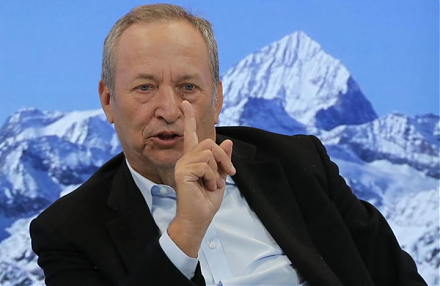
The Economist re-evaluates the realistic scenario that the world has learned few lessons of the global financial crisis from 2008 to 2009 over the past deca
2018-12-03 10:40:00 Monday ET
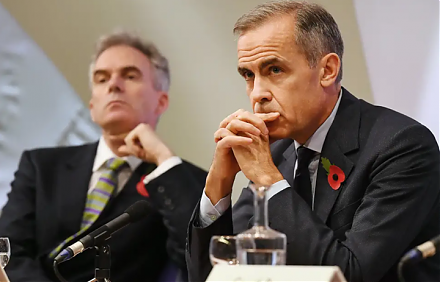
Bank of England publishes its latest insights into the economic impact of Brexit on British real productivity, capital investment, and labor supply as of 20
2019-03-11 10:32:00 Monday ET

Lyft seeks to go public with a dual-class stock ownership structure that allows the co-founders to retain significant influence over the rideshare tech unic
2017-11-25 06:34:00 Saturday ET
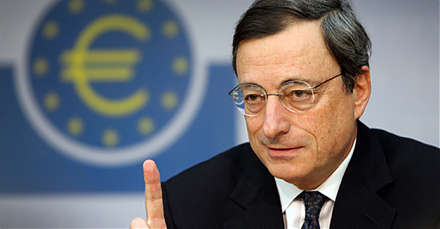
Mario Draghi, President of the European Central Bank, heads the international committee of financial supervisors and has declared their landmark agreement o
2025-06-05 00:00:00 Thursday ET

Former New York Times team journalist and Pulitzer Prize winner Charles Duhigg describes, discusses, and delves into how we can change our respective lives