2019-05-01 09:27:00 Wednesday ET

Apple settles its 2-year intellectual property lawsuit with Qualcomm by agreeing to a multi-year patent license with royalty payments to the microchip maker
2020-01-15 08:31:00 Wednesday ET

Anti-competitive corporate practices may stifle U.S. innovation. In recent decades, wage growth, economic output, and productivity tend to stagnate as U.S.
2017-08-19 14:43:00 Saturday ET

In a recent tweet, President Donald Trump criticizes Amazon over taxes and jobs. Without providing specific evidence, Trump accuses of the e-commerce retail
2024-02-05 11:26:00 Monday ET

China poses new economic, technological, and military threats to the U.S. and many western allies. In the U.S. government assessment, China poses new eco
2019-12-01 10:31:00 Sunday ET
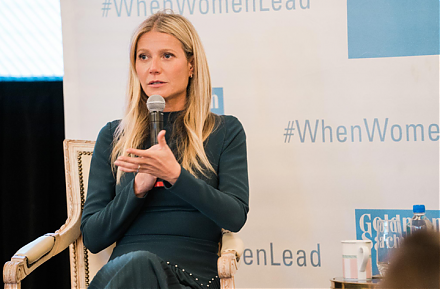
Goop Founder and CEO Gwyneth Paltrow serves as a great inspiration for female entrepreneurs. Paltrow designs Goop as an online newsletter, and this newslett
2025-02-02 11:28:00 Sunday ET
Our proprietary alpha investment model outperforms most stock market indexes from 2017 to 2025. Our proprietary alpha investment model outperforms the ma