
2019-08-24 14:38:00 Sat ET
stock market gold oil stock return s&p 500 asset market stabilization asset price fluctuations stocks bonds currencies commodities funds term spreads credit spreads fair value spreads asset investments

Warren Buffett warns that the current cap ratio of U.S. stock market capitalization to real GDP seems to be much higher than the long-run average benchmark. With the current cap ratio of 146.4x, U.S. stock market capitalization represents at least 146 times American national income per year. This current cap ratio exceeds the long-run average benchmark of 80x by more than 80%, and is historically second to the peak of irrational exuberance near 148.5x during the dotcom bubble back in March 2000. From 2018Q3 to 2019Q2, the S&P 500 delivers a 12-month net profit of about $135 per share, and the S&P 500 aggregate share price rises to $3000+ per share. The equivalent S&P 500 P/E ratio thus hovers in the broad range of 22x to 24x. This narrow range well exceeds the long-run average benchmark of 15x to 16x. Long-term stock market capitalization and corporate profitability should move in tandem. If these key metrics stray too far apart, it can be prohibitively expensive for U.S. public corporations to get back to balance.
From this fundamental perspective, the normal stock market forces may pull equity valuation back to the long-run average yardsticks relative to U.S. national income and corporate profitability.
If any of our AYA Analytica financial health memos (FHM), blog posts, ebooks, newsletters, and notifications etc, or any other form of online content curation, involves potential copyright concerns, please feel free to contact us at service@ayafintech.network so that we can remove relevant content in response to any such request within a reasonable time frame.
2017-08-01 09:40:00 Tuesday ET
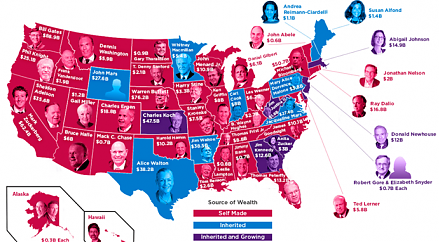
In American states, all of the Top 4 richest people are self-made billionaires: Bill Gates in Washington, Warren Buffett in Nebraska, Michael Bloomberg in N
2019-04-27 16:41:00 Saturday ET

Tony Robbins suggests that one has to be able to make money during sleep hours in order to reach financial freedom. Most of our jobs and life experiences tr
2020-08-19 10:32:00 Wednesday ET

Corporate strategies, portfolio choices, and management memes add value and drive business process improvements over time. Andrew Campbell, Jo Whitehead,
2017-06-15 07:32:00 Thursday ET

President Donald Trump has discussed with the CEOs of large multinational corporations such as Apple, Microsoft, Google, and Amazon. This discussion include
2017-03-09 05:32:00 Thursday ET

From 1927 to 2017, the U.S. stock market has delivered a hefty average return of about 11% per annum. The U.S. average stock market return is high in stark
2019-08-05 13:30:00 Monday ET

China continues to sell U.S. Treasury bonds amid Sino-U.S. trade truce uncertainty. In mid-2019, China reduces its U.S. Treasury bond positions by $20.5 bil