2018-10-19 13:37:00 Friday ET
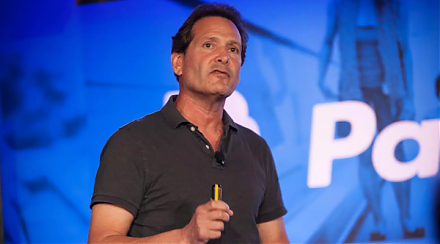
PayPal earns great fintech reputation from its massive worldwide network of 250+ million active users. As PayPal beats the revenue and profit expectations o
2018-05-02 06:32:00 Wednesday ET
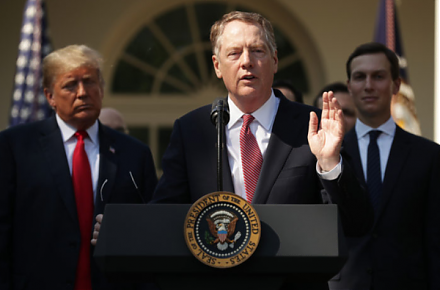
What are the primary pros and cons of free trade or fair trade in the current Sino-American quagmire? Free trade means allowing goods and services to move a
2018-09-01 07:34:00 Saturday ET

As the French economist who studies global economic inequality in his recent book *Capital in the New Century*, Thomas Piketty co-authors with John Bates Cl
2017-08-13 09:36:00 Sunday ET
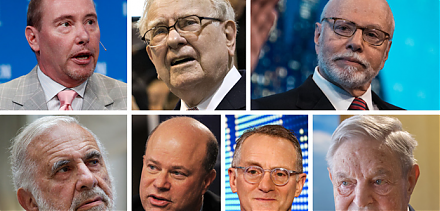
Several investors and billionaires such as George Soros, Warren Buffett, Carl Icahn, and Howard Marks suggest that the time may be ripe for a major financia
2019-07-17 12:37:00 Wednesday ET
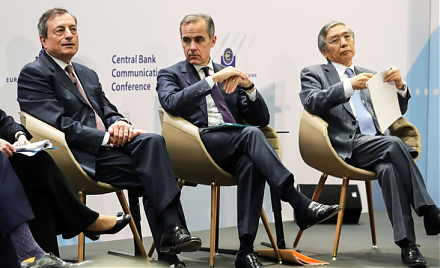
Gold prices surge above $1400 per ounce amid global trade tension and economic policy uncertainty. Both European Central Bank and Bank of Japan may consider
2019-10-25 07:49:00 Friday ET
U.S. fiscal budget deficit hits $1 trillion or the highest level in 7 years. The current U.S. Treasury fiscal budget deficit rises from $779 billion to $1.0