2023-09-21 09:26:00 Thursday ET
Jordi Gali delves into the science of the New Keynesian monetary policy framework with economic output and inflation stabilization. Jordi Gali (2015)
2019-02-15 11:33:00 Friday ET
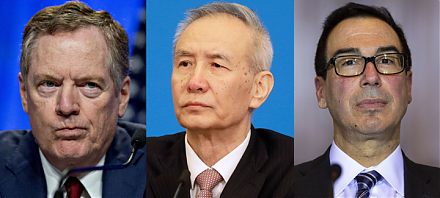
President Trump is open to extending the March 2019 deadline for raising tariffs on Chinese imports if both sides are close to mutual agreement. These bilat
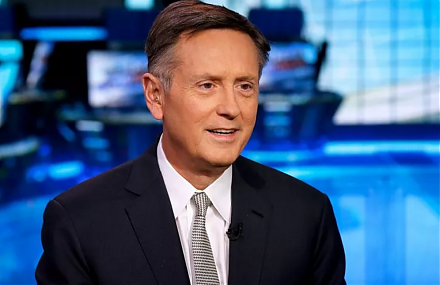
2019-06-11 12:33:00 Tuesday ET
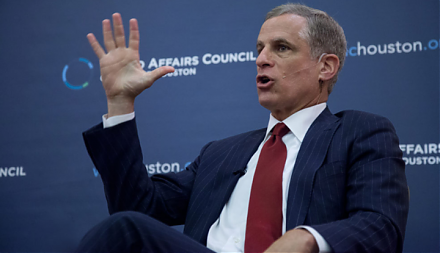
Dallas Federal Reserve Bank President Robert Kaplan expects the U.S. economy to grow at 2.2%-2.5% in 2019-2020 as inflation rises a bit. In an interview wit
2019-08-22 11:35:00 Thursday ET
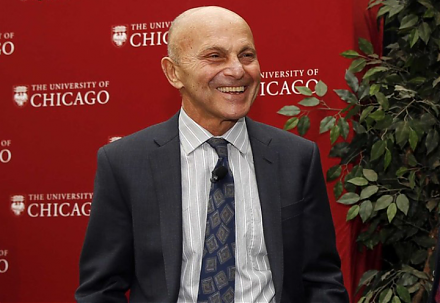
Fundamental factors often reflect macroeconomic innovations and so help inform better stock investment decisions. Nobel Laureate Eugene Fama and his long-ti
2022-04-05 17:39:00 Tuesday ET

Corporate diversification theory and evidence A recent strand of corporate diversification literature spans at least three generations. The first generat
2019-11-11 09:36:00 Monday ET
Apple upstream semiconductor chipmaker TSMC boosts capital expenditures to $15 billion with almost 10% revenue growth by December 2019. Due to high global d