2017-03-21 09:37:00 Tuesday ET
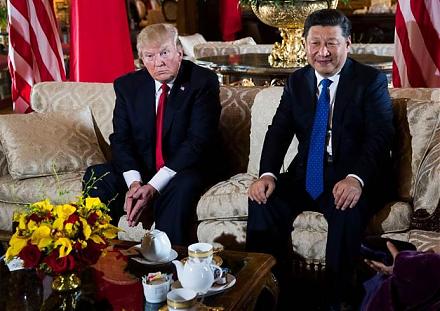
Trump and Xi meet in the most important summit on earth this year. Trump has promised to retaliate against China's currency misalignment, steel trade
2018-11-29 11:33:00 Thursday ET
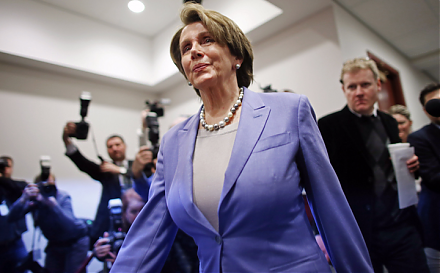
A congressional division between Democrats and Republicans can cause ripple effects on Trump economic reforms. As Democrats have successfully flipped the Ho
2017-02-13 09:35:00 Monday ET
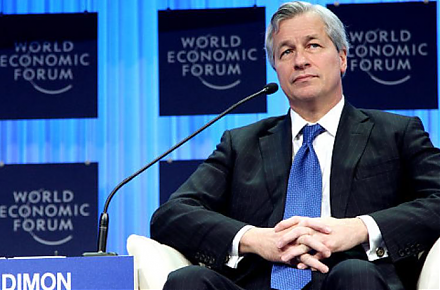
JPMorgan Chase CEO Jamie Dimon says President Trump has now awaken the *animal spirits* in the U.S. stock market. The key phrase, animal spirits, is the
2019-03-19 12:35:00 Tuesday ET
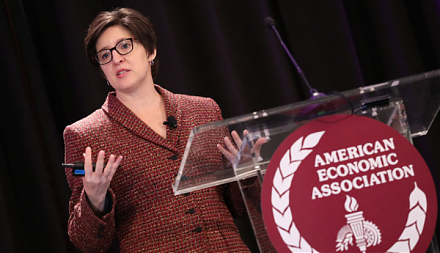
U.S. tech titans increasingly hire PhD economists to help solve business problems. These key tech titans include Facebook, Amazon, Microsoft, Google, Apple,
2018-03-05 07:34:00 Monday ET
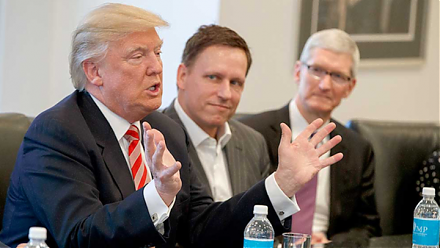
Peter Thiel shares his money views of President Trump, Facebook, Bitcoin, global finance, and trade etc. As an early technology adopter, Thiel invests in Fa
2018-12-29 09:32:00 Saturday ET

Andy Yeh Alpha (AYA) AYA Analytica financial health memo (FHM) podcast channel on YouTube December 2018 AYA Analytica is our online regular podcast and news