2018-12-07 11:35:00 Friday ET
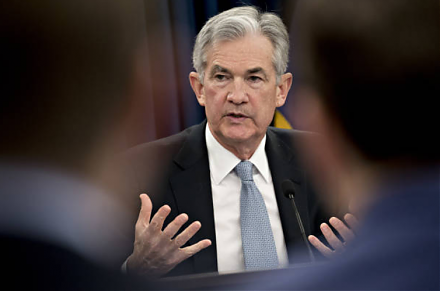
Fed Chair Jerome Powell hints slower interest rate increases because the current rate is just below the neutral threshold. NYSE and NASDAQ share prices rebo
2022-04-15 10:32:00 Friday ET

Corporate investment management This review of corporate investment literature focuses on some recent empirical studies of M&A, capital investm
2016-11-09 00:00:00 Wednesday ET

Universally dismissed as a vanity presidential candidate when he entered a field crowded with Republican talent, the former Democrat and former Independent
2023-02-07 08:26:00 Tuesday ET
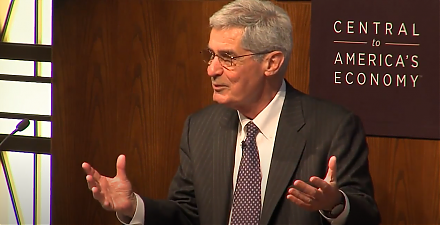
Michel De Vroey delves into the global history of macroeconomic theories from real business cycles to persistent monetary effects. Michel De Vroey (2016)
2017-11-17 09:42:00 Friday ET
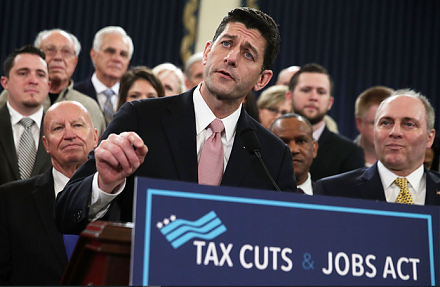
The Trump administration garners congressional support from both Senate and the House of Representatives to pass the $1.5 trillion tax overhaul (Tax Cuts &a
2018-02-03 07:42:00 Saturday ET
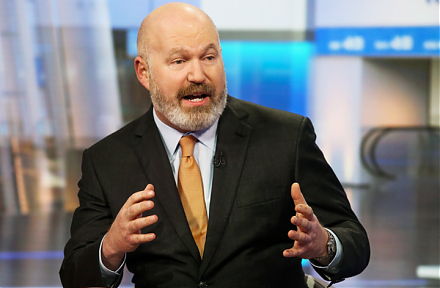
Quant Quake 2.0 shakes investor confidence with rampant stock market fears and doubts during the recent Fed Chair transition from Janet Yellen to Jerome Pow