2020-08-12 07:25:00 Wednesday ET

Most sustainably successful business leaders make a mark in the world, create a positive impact, and challenge the status quo. Jerry Porras, Stewart Emer
2017-09-13 10:35:00 Wednesday ET

CNBC reports the Top 5 features of Apple's iPhone X. This new product release can be the rising tide that lifts all boats in Apple's upstream value
2019-11-01 12:31:00 Friday ET

Kourtney Kardashian shares the best money advice from her father. This advice reminds her that money just cannot buy happiness. As the eldest of the Kardash
2017-12-11 08:42:00 Monday ET
Fed Chair Janet Yellen says the current high stock market valuation does not mean overvaluation. A stock market quick fire sale would pose minimal risk to t
2019-10-05 07:27:00 Saturday ET
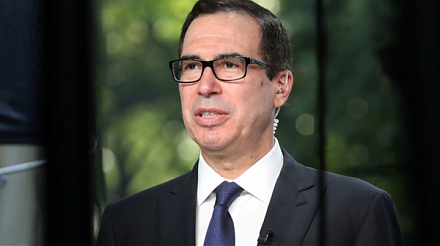
Treasury Secretary Steven Mnuchin indicates that there is a good conceptual trade agreement between China and the U.S. in regard to intellectual property pr
2019-03-21 12:33:00 Thursday ET
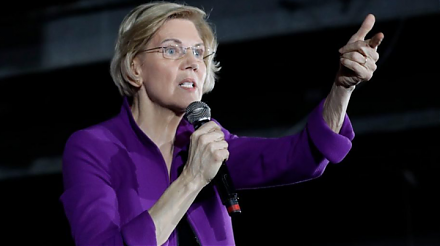
Senator Elizabeth Warren proposes breaking up key tech titans such as Facebook, Apple, Microsoft, Google, and Amazon (FAMGA). These tech titans have become